We are pleased to announce the integration of our innovative Management Dashboard with the intrusion and VoIP plugins developed by SGSE. This Dashboard has been designed to enhance and complement the advanced functionalities of SGSE’s plugins on the Milestone XProtect platform, providing a comprehensive and centralized solution for monitoring, managing security, and communications on your network.
SGSE in the Digital Age
he security of facilities and the efficiency of communications are fundamental aspects for any organization. This Dashboard is designed to provide a centralized and detailed view of the data collected from multiple intrusion systems from different manufacturers (Galaxy-SPC) and the VoIP system (GrandStream), allowing administrators and security teams to monitor, analyze, and proactively respond to any incidents.
Centralized Monitoring: Consolidate information from various intrusion and VoIP systems through our plugin(s), facilitating access and management of relevant data.
Real-Time Analysis: Provide real-time analysis and visualization of events and alerts, helping to identify and mitigate potential discrepancies promptly.
Improved Security and Organization: Allow for quick identification of patterns and trends that could indicate intrusion attempts or issues in the VoIP system, thus improving the organization’s security posture.
Detailed Data Management: Possibility to export different data, both visual and raw data. With one click, you have three options: Export to PDF, export to a chart, and finally to an Excel format.
Transform Your Management with a Dashboard
The SGSE Dashboard is not just a tool; it is a comprehensive solution that transforms how your organization manages security and communications. By combining advanced features with unparalleled ease of use, the Dashboard provides you with:
Total Visibility: Get a complete and unified view of your intrusion and VoIP systems, all in one place.
Enhanced Performance: Optimize operational efficiency and the quality of communications and intrusion, ensuring smooth, detailed, and trouble-free operations.
Informed Decision-Making: Base your decisions on accurate and up-to-date data, improving your ability to anticipate and respond to any challenge.
Increase Your Competitiveness with SGSE
By choosing a Management Dashboard, you are investing in a tool that offers unparalleled value and a significant return. Equipped with the best features on the market, a Dashboard is the perfect complement to the intrusion and VoIP plugins created by SGSE, ensuring that your organization is always prepared and at the forefront of effective management.
Do not wait any longer to transform your security and communications management. Contact us today to discover how a Dashboard can drive your organization towards success.
Interacting with the Dashboard
The Dashboard allows us to obtain information efficiently and coherently with our needs and to handle information quickly and accurately, enabling your team to make appropriate real-time decisions.
Detailed Information and Filtering
Explore the advanced filtering capabilities and enjoy the detailed analysis that only SGSE, the manufacturer of this solution, can offer. With SGSE, you will obtain a clear and detailed view of your security and VoIP system, optimizing its performance and efficiency.
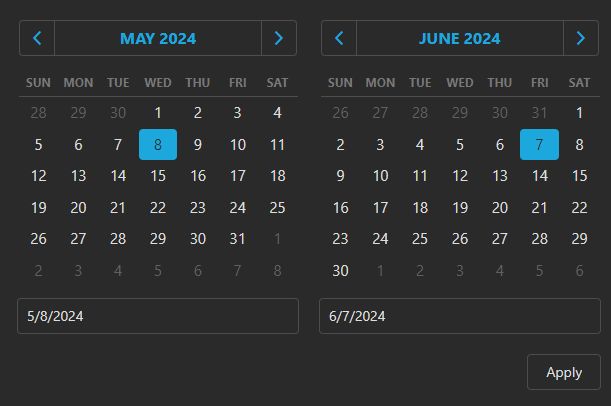
Main Filter “Time”
The common filter for this Dashboard is time. We have created a highly dynamic and simple environment that includes easily executable pre-set times as well as a customizable filter.
Enjoy the flexibility and efficiency that our SGSE solution offers you, allowing you to adjust the time filters according to your specific needs for a detailed and precise analysis.
Maximize/Minimize
The Dashboard has the option to maximize and minimize the different charts. To maximize one of the different charts, place the mouse in the upper right corner and you will see the maximize symbol appear, click it, and the chart will occupy the entire panel.
Export
There are three options: Export to PDF, export to a chart, and finally to an Excel format.
DASHBOARDS
1.SPC Dashboard and Galaxy Dashboard: Access the Dashboard (SPC or Galaxy) in the Milestone environment (fully integrated into Milestone)
The Dashboards are divided into two distinct parts: one is the graphical part and the other is purely the data that builds the graphical environment. They are quickly distinguished as:
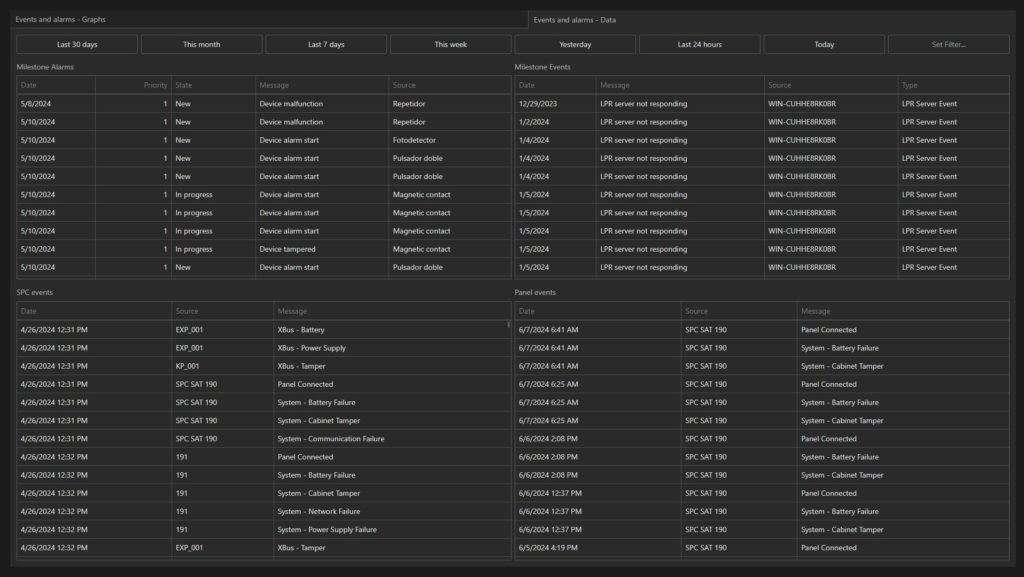
Events and Alarms – Graphs
Events and Alarms – Data.
Graph Panels
Total Alarm Status
Displays the count of all alarms and indicates the number in each managed state (In process, new, managed, etc.).
Alarm Status by Days
A graphic panel that shows the data more specifically, segmented by days.
Zone Cancellation Time
A dynamic information panel that allows us to see the different zones managed by the panel, as well as establish comparisons between various zones.
Events by Zone
A dynamic information panel that allows us to see the different zones managed by the panel, as well as establish comparisons between various zones.
Events by Panel
There is a panel that shows the faults and/or anomalies detected by the panel.
Events and Alarms - Data
All the information exists in data form, and this is what we show from the «events and alarms» tab.
Data Panels
The information shown is summarized in the following panels, to which we apply the time formula. The different representative panels of the information are as follows:
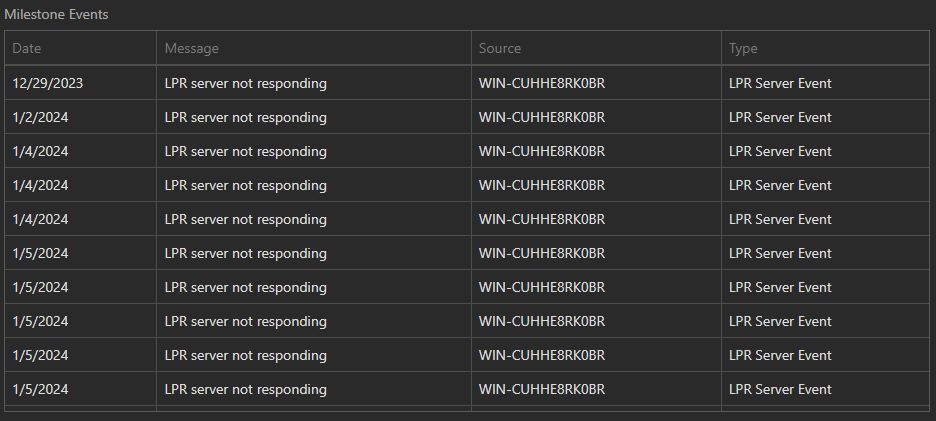
Alarms (Milestone).
Events (Milestone).
Intrusion Panel Events.
Intrusion Panel Events.
Alarm Data
There is a panel that shows the faults and/or anomalies detected by the panel.
Event Data
All events managed by Milestone are displayed in the established period. The header fields of the different tables allow sorting the collected data (ascending-descending or alphabetically).
Intrusion Panel Events
All events managed by the Plugin corresponding to the management performed by the intrusion panel on field elements (zones, areas, Xbus, etc.) are displayed in the established period. The header fields of the different tables allow sorting the collected data (ascending-descending or alphabetically).
Panel Events
All events managed by the Plugin of the corresponding intrusion panel are displayed. It only includes those of the panel; the rest of the elements managed by the panel are displayed in the previous panel in the established period. The header fields of the different tables allow sorting the collected data (ascending-descending or alphabetically).
2. VoIP Dashboard
Dashboard VoIP
The VoIP Dashboard shows a summary of the information movements that occurred in your PBX with the details related to its management.
Let’s detail the different functionalities of our Dashboard.
This Dashboard is divided into two distinct parts: one is the graphical part, and the other is purely the data that builds the graphical environment. They are quickly distinguished as:
Calls – Graphs.
Calls – Data.
Calls - Graphs
Number of Calls per Day
By hovering over the chosen day, a window will pop up indicating the obtained data, allowing an exact understanding of the calls managed in the selected period.
Call Duration per Day
Details of the duration of the calls and the time taken to attend them.
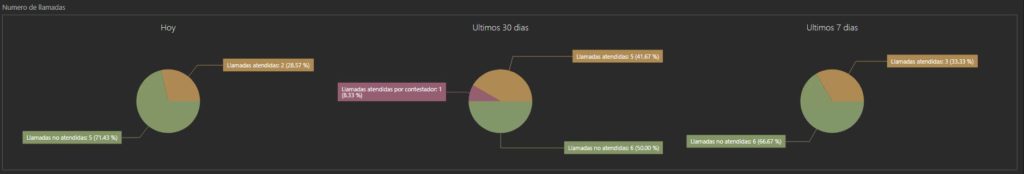
Number of Calls
Count of the number of attended and unattended calls during the selected period.
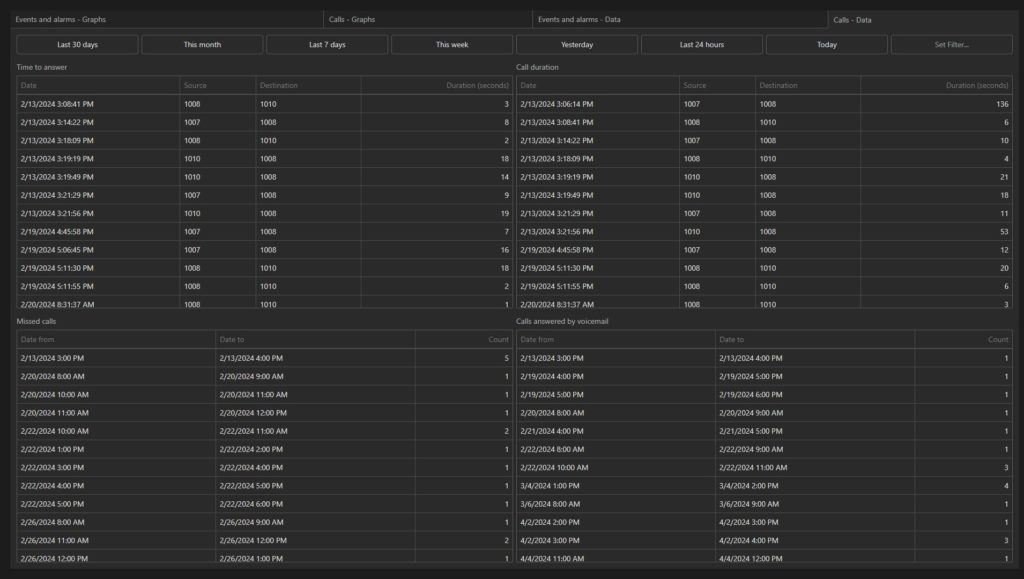
Calls - Data Mode
The ‘Calls – Data’ tab will show you a new functionality related to the data recorded by the Plugins.
Data Panels
Response Time
Interval of time from when a call enters the system until it is answered by an operator. It is a key indicator of customer service efficiency. A short wait time generally indicates a good level of service and prompt customer attention.
Call Duration
The total time a phone call lasts, from when the operator answers until the call ends. This data is useful for analyzing operator productivity and the complexity of the queries or issues they handle. It also helps to plan resources and work schedules.
Unattended Calls
Those calls that enter the system but are not answered by an operator. These can include calls that are abandoned before being answered, missed calls, or those not answered within a reasonable time. A high number of unattended calls may indicate problems in the call center’s response capacity, leading to customer dissatisfaction and potential business loss.
Calls Answered by Answering Machine
Relates to calls not answered by a human operator but handled by an automated answering system. This can include Interactive Voice Response (IVR) systems that provide information or redirect calls, or simply a voicemail where the customer can leave a message.
This indicator is crucial to understanding how many interactions are being handled automatically instead of by live personnel. Appropriate use of automated answering systems can improve efficiency, but excessive use may lead to customer frustration if they cannot resolve their issue quickly.
These points are fundamental for evaluating and improving the performance and efficiency of a telephone service system.
Conclusion
These Dashboards are a powerful tool for managing intrusion data and the quality of the VoIP service your company can offer. With its intuitive interface and advanced monitoring and analysis capabilities, users can stay informed and prepared to respond effectively to any incidents. Explore this guide to learn more about how to use all the functionalities offered by this system.
The management Dashboard not only complements but significantly enriches the functionality of SGSE’s intrusion and VoIP plugins. By combining these tools, we offer a robust and complete solution for network protection and optimization, ensuring that your organization is always one step ahead of the threats and challenges of today’s digital environment.
For more information on integrating the dashboard with SGSE plugins, feel free to contact us.
Demo videos
SPC
Downloads
Download this post
Esta página utiliza cookies y otras tecnologías para que podamos mejorar tu experiencia en nuestro sitio: Más información.